ATS Pivot Tables
Listed in this section are a number of common pivot tables for error-checking your project setup.
Destination Check
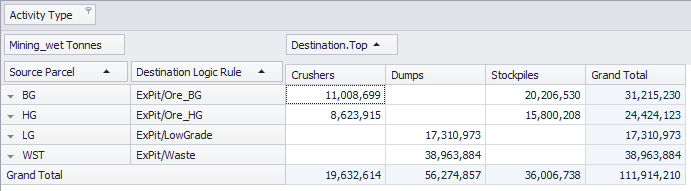
Create a pivot table to validate the destination logic setup:
- Go to Schedule tab > Reporting tab >
 Add Pivot Report.
 - Click in the name field and rename to "Destination Check".
- Drag Activity Type into the Filter Area and set the filter to show Mining only.
- Drag Mining_wetTonnes into the Data Area.
- Drag Destination.Top into the Columns Area.
- Drag Source Parcel into the Row Area.
- Drag Destination Logic Rule into the Row Area.
Use this table to identify if any Destination Rules are sending material to the wrong location.
For added detail, try dragging Source.Mine/Pit/Stage into the Row Area.
Step Logic Check
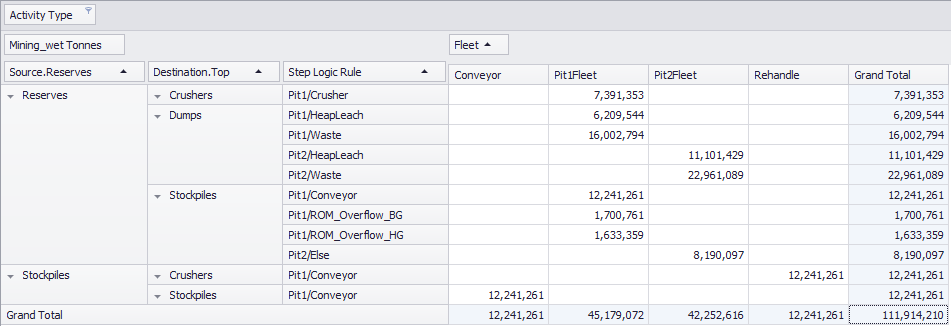
Create a pivot table to validate the step logic setup:
- Go to Schedule tab > Reporting tab > Add Pivot Report.
- Click in the name field and rename to "Step Logic Check".
- Drag Activity Type into the Filter Area and set the filter to show Mining only.
- Drag Mining_wetTonnes into the Data Area.
- Drag Fleet into the Column Area.
- Drag into the Row Area:
- Source.OpenPit
- Destination.Top
- Step Logic Rule
For added detail, try adding Source Type and Destination Type to see the individual step logic components.
Use this table to identify if any Step Rules are using fleets in the wrong areas.
Bench Progression
Create a pivot table to visualise the bench progression by pit and stage:
- Go to Schedule tab > Reporting tab > Add Pivot Report.
- Click in the name field and rename to "Bench Progression".
- Drag Source.OpenPit into the Filter Area and set the filter to show OpenPit only.
- Drag Mining_wetTonnes into the Data Area.
- Drag Period into the Column Area.
- Drag into the Row Area: Source.Mine / Pit / Stage / Bench
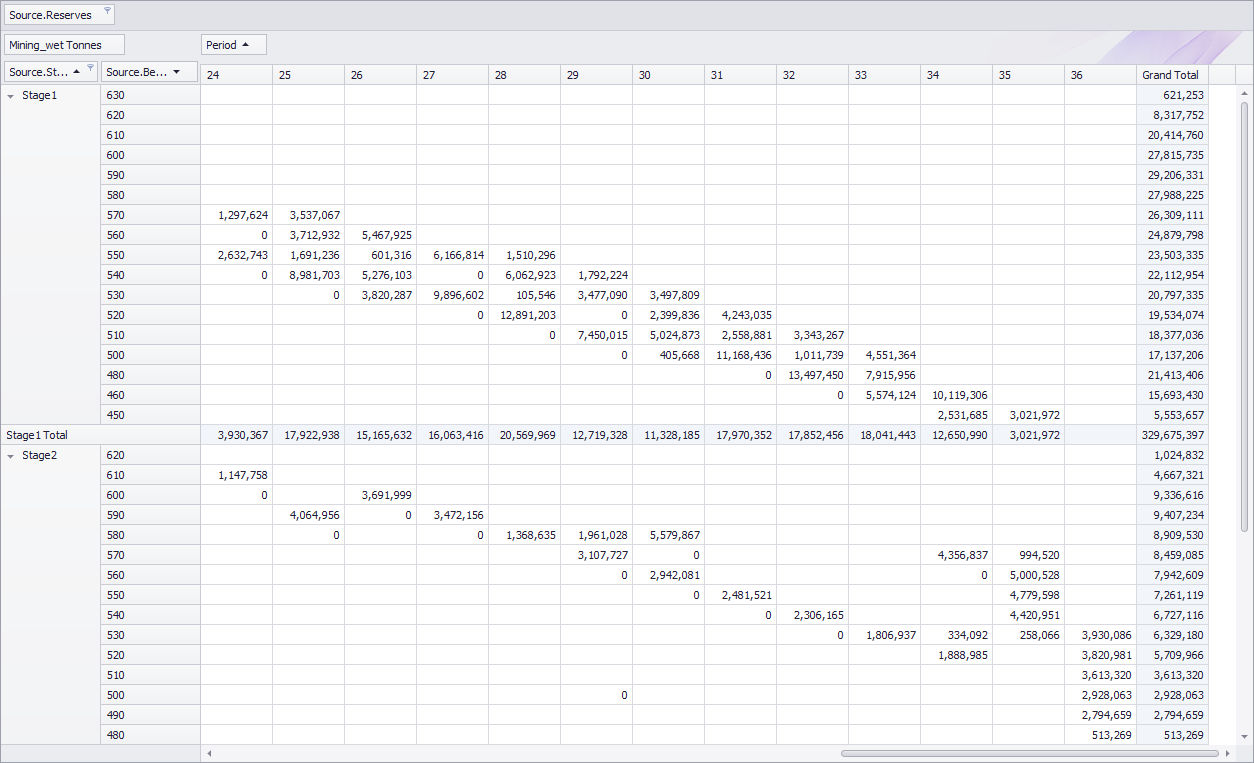
Bench progression pivot table
Use this table to confirm that bench turnover is within practical limits per period.
Loader Rate Check
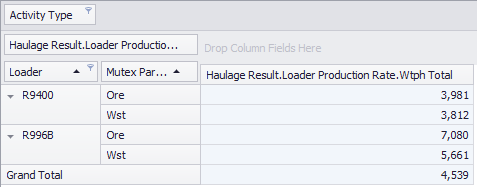
Create a pivot table to validate the production rates being used by the excavation equipment:
- Go to Schedule tab > Reporting tab > Add Pivot Report.
- Click in the name field and rename to "Loader Rate Check".
- Drag Activity Type into the Filter Area and set the filter to show Mining only.
- Drag Loader into the Row Area.
- Drag MutexParcel.Haulage into the Row Area.
- Drag HaulageResult.LoaderProductionRate.WTPH into the Data Area.
For projects using Loaders as Agents, drag Agent Rate field into the Data Area for direct comparison.
Use this table to confirm the loader rates match with planning parameters.
Cycle Time Check
Create a pivot table to validate the average cycle times being used by trucks.
- Go to Schedule tab > Reporting tab > Add Pivot Report.
- Click in the name field and rename to "Cycle Time Check".
- Drag Activity Type into the Filter Area and set the filter to show Mining only.
- Drag Truck into the Row Area.
- Drag Source.Mine/Pit/Stage into the Row Area.
- Drag Destination.Name into the Column Area.
- Drag HaulageResult.Times.Total into the Data Area.
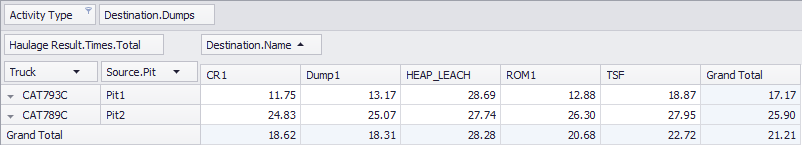
Average cycle time pivot table
Use this table to confirm the average cycle times match with historical numbers.
Note that the HaulageResult fields return the instantaneous property of the haul cycle. For instance, "HaulageResult.FuelBurn.Total" is the fuel burn of a single return trip on that haul, not the actual fuel burned for this schedule transaction (which may represent a fraction of a haul). The same goes for HaulageResult.Distance, HaulageResult.Times, and so on.
To calculate the actual time or fuel used, you must take the sumproduct of the property with HaulageResult.NumberOfTrips.