...
The Database tab consists of six main parts, which are described in details below:
| Table of Contents |
|---|
(1) Records Panel
The Records panel is represented by a window on the left side of the Database tab. You can Auto Hide this panel or pin it to show in the tab to ease the work with its data.
...
By pressing on a level it will display in the Viewport Display. You may also select the whole reserve/mine/pit/stage/bench to display or selected solids using <CTRL> and <Shift> hotkeys.
Select the subset you want to work with from the Record Subsets dropdown list. The information in the Data panel as well as in the Viewport Display will be automatically updated.
...
(2) Viewport Display
The Viewport Display provides a representation of all the solids of Reserves and Dumps on your mine site. The user can select the levels to be displayed (mine / pit / stage / bench, etc.), switch to the display of dumps or open pits, or zoom in to one or multiple solids.
The following buttons and dropdowns are provided at the top of the viewport, they are useful for customizing the schedule display according to users preferences.
Visibility Mode button | 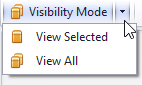 | Graphics view mode. Change current viewing mode which affects how data is displayed in the viewport below. Click on the dropdown list to select "View Selected" or "View All". |
|---|---|---|
Labels button | 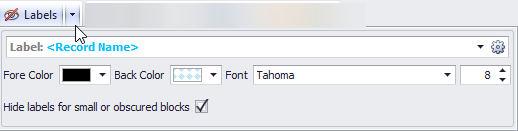 | Toggle this button to enable/hide labels. Click on the dropdown list to open the Label Display Settings window, where you can set the type of labels to display, their colors, font, size, as well as open Configure Labels dialog, where you can create custom labels (more details see here). |
Box Selection |  | Left click and drag to select multiple blocks |
Pan |  | Middle click and drag |
Orbit |  | Right click and drag |
Zoom |  | Scroll wheel |
Zoom Fit |  | Left click on the compass widget |
Grid |  | Toggle grid |
Measure |  | Function for measuring the distance between two marked points |
Capture Screenshot | 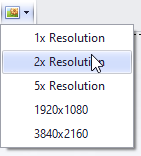 | The screenshot tool saves the current view to clipboard for pasting into reports or presentations. Screenshots can be taken in different resolutions so that you always have clear, crisp images to share. |
(3) Data Panel
The Data panel allows the user to organize the data being processed. The main panel area lists all related fields, displayed according to the selected blocks in the Viewport Display or in the Records panel. To the left of the name of each field there is a small triangle icon, clicking on which will reveal or hide the hierarchy of this level. Use this feature to simplify and filter the data you need to work with.
Data panel items are listed below
Data View Mode |  | Change current data viewing mode which affects how data is displayed in the grid below |
|---|---|---|
Activity field |  | Choose from the dropdown one of the activities to display |
Parcel Subset field | 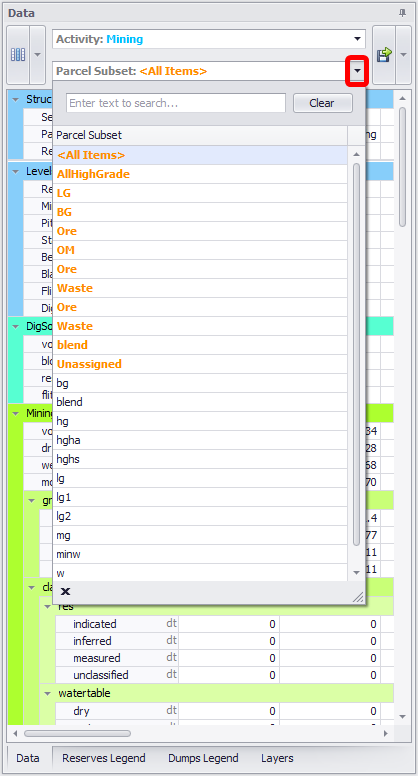 | Click to select displayed parcel subsets from the dropdown |
Export button |  | Export options, see here for more details |
(4) Reserves Legend
The Reserves Legend tab is located at the bottom of the Data Panel. Click on this tab to expand it.
...
Press the blue plus icon to add a new shading.
Enter the name of the shading in the Name field.
Drop down the Shading Field and select the shading criteria, such as "Mining_grades_fe".
Enter the cutoff grades in the table below the histogram.
Either type numbers directly in the Value field, or
Press Create by Equal Counts or Create by Equal Intervals button to generate a colour range based on counts or intervals.
Press OK to finish.
...
(5) Dumps Legend
The Dumps Legend tab is located at the bottom next to the Reserves Legend tab. Click on this tab to expand it. It has same elements and functions as the Reserves Legend described above, only applicable to Dumps.
(6) Layers Panel
The Layers panel is a screen component found in all Alastri applications. This panel is used to add / remove / arrange and perform other operations with layers and overlays. For a detailed description of the elements of the Layers panel and recommendations for its use, click here.